Local Kubernetes Development with kind
kind is a tool built for running local Kubernetes clusters using Docker containers as nodes. kind was primarily designed for testing Kubernetes itself, but it is actually quite useful for creating a Kubernetes environment for local development, QA, or CI/CD. This blog post shows you how to setup a kind-based environment for local development that can mimic a production Kubernetes environment.
A fully functioning environment using kind includes a few different components. For our purposes, we will install the following list of software.
- Docker.
- The kubectl tool.
- A local Docker registry.
- kind.
- An Ingress controller.
We can use these steps to create a repeatable script to setup a local Kubernetes cluster whenever you need it.
Docker
The kind project stands for “Kubernetes in Docker”. As such, you will need to install Docker to get started. This is typically environment specific, and you may need to consult the Docker documentation if you get stuck. The following should get you started:
macOS
The easiest way to install Docker for macOS is using Docker Desktop by going to the download page and grabbing the image. Click-to-install and you should be ready to go.
Linux (Ubuntu)
Older versions of Docker were called docker, docker.io, or docker-engine. If these are installed you should start by getting rid of them:
Once done, you can add the Docker apt repository to support future installations over apt. To do so, we need to first install packages necessary for installing from apt over HTTPS.
Then, we can add the Docker apt repository by adding Docker’s GPG key and followed by adding the apt repository.
Lastly, update the apt repository given the new Docker source, and install Docker.
Windows with WSL2
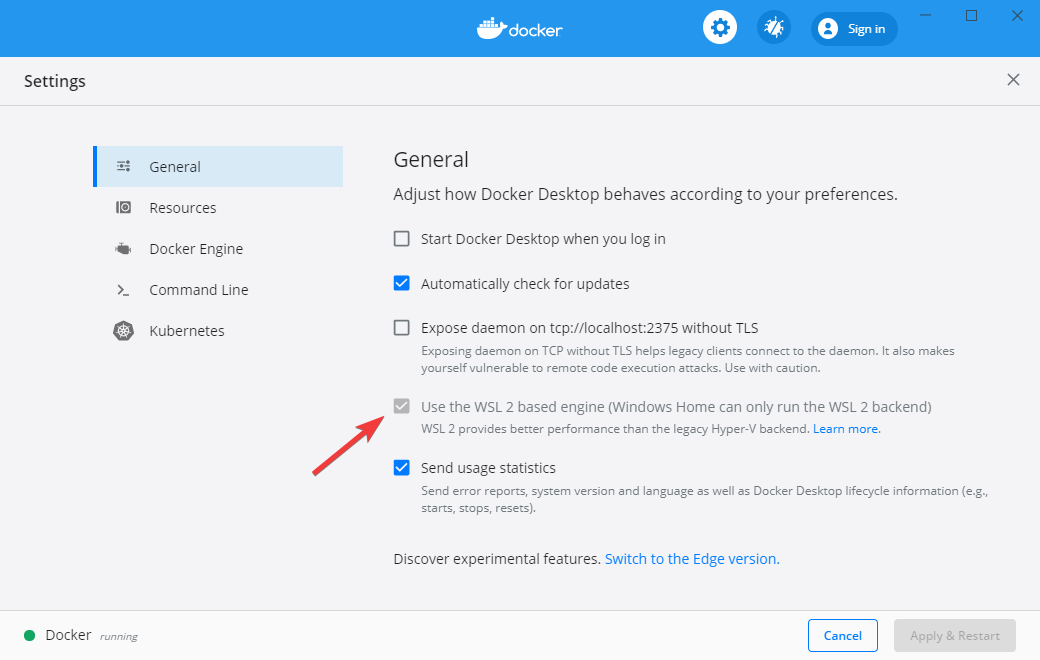
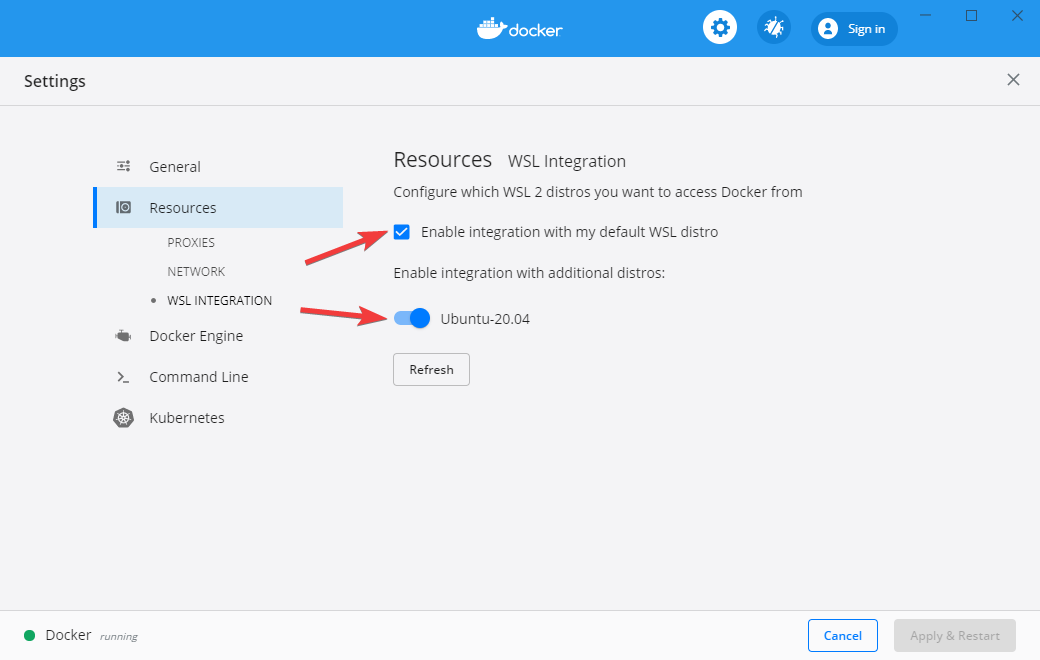
Newer versions of Windows include the Windows Subsystem for Linux 2 (WSL2) that provides excellent integration with Docker. To get started you first need to install WSL2 using the instructions here. Once this is done, you can install Docker Desktop.
After Docker Desktop is installed, open the Docker dashboard and make sure that WSL2 integration is enabled. This involves checking a few boxes: one for enabling WSL2 as the Docker engine backend, and a second for enabling WSL2 for the particular Linux images you are using.
Kubectl
kind does not strictly require kubectl, but because we are aiming to setup a fully functioning development environment we are going to install kubectl to be able to do some basic Kubernetes functions on our cluster.
If you get stuck at any point, refer to the official kubectl installation instructions.
macOS
On macOS, kubectl is available through Homebrew
Linux (Ubuntu)
Linux users (and Windows users using WSL2) can fetch kubectl through the Google apt repository:
kind
Now we can finally install kind. Kind publishes binaries to Github. These can be installed through Homebrew on a Mac, or by downloading the release for Linux distributions.
macOS
Linux (Ubuntu)
Creating Kubernetes clusteres using kind
kind is a tool for running local Kubernetes clusters using Docker containers as Kubernetes Nodes. To see how this work, let’s create a cluster with the default settings:
By default, this will create a single Kubernetes node running as a docker container named kind-control-plane and configures kubectl to use this cluster. You can view the Docker container running your cluster through the docker ps command:
Or through your newly configured kubectl.
You can delete your cluster at any time using the kind delete cluster command:
You can also run a specific version of Kubernetes using the --image flag. For example, to create a Kubernetes cluster using version 1.14.10 of Kubernetes you would use the following command:
Adding more nodes to your cluster
By default, kind creates a cluster with a single node. You can add additional nodes using a yaml-based configuration file that follows Kubernetes conventions. A minimum viable configuration just specifies the type of resource to create (Cluster), and the apiVersion to use:
By saving this configuration to a file, you can create a cluster using it through the --config flag.
You can add more nodes to your cluster by altering this configuration. This creates a more “realistic” Kubernetes environment, but is really not necessary unless you are testing specific features like rolling updates.
We can create a cluster using this configuration using the create cluster command.
And view the three running nodes with kubectl.
Go ahead and delete this cluster before continuing on.
Creating a local Docker registry
One of the challenges in using Kubernetes for local development is getting local Docker containers you create during development to your Kubernetes cluster. Configuring this correctly allows Kubernetes to access any Docker images you create locally when deploying your Pods and Services to the cluster you created using kind. There are a few ways to solve this problem, but the one I prefer is to create a local Docker registry that your Kubernetes cluster can access. This version most closely matches a production deployment of Kubernetes.
The following example creates a Docker registry called kind-registry running locally on port 5000. This script first inspects the current environment to check if we already have a local registry running, and if we do not, then we start a new registry. The registry itself is simply an instance of the registry Docker image available on Docker Hub. We use the docker run command to start the registry.
Now that we have a registry created, we can configure kind to use this registry for pulling container images during deployments. We do this using the configuration below. In this example, we run a single node Kubernetes cluster add some configuration to the containerd interface to allow pulling images from a local Docker registry.
We can save this file as local-registry.yaml and then create the cluster using kind:
The last step we have is to connect the kind cluster’s network with the local Docker registry’s network:
Deploying an application to your cluster
Now that we have kind deployed and a local registry enabled, we can test the cluster by deploying a new service. For this demonstration, I’ve created a simple Python server using Flask, and a corresponding Dockerfile to package it for deployment to our Kubernetes cluster.
Here is our simple Python server:
And the corresponding Docker file:
You can build this application as a Docker container using the docker build command. The following line tags the build using the -t flag and specifies the local repository we created earlier.
At this point, we have a Docker container built and tagged. Next we can push it to our local repository with the docker push command.
You can check that this application is working by running the newly built Docker container and navigating to localhost:8080:
Ingress into kind
Since a typical service needs to be accessed by the Internet, we will also run an Ingress controller to broker connections between our local environment and the Kubernetes cluster. We do this by adding a few extra directives to the configuration of our cluster and then deploying the nginx Ingress controller.
We start by create a kind cluster with extraPortMappings and node-labels directives.
- extraPortMappings allows
localhostto make requests to the Ingress controller over ports 80/443. This is similar to Docker’s-pflag. - node-labels restricts the Ingress controller to run on a specific set of nodes matching the label selector.
You can save this yaml file as kind-ingress.yaml and create the cluster using the kind create cluster command:
Our cluster is now capable of supporting Ingress controllers, so we can deploy one of the available options. In this tutorial I will use Nginx ingress which provides a deployment we can leverage through Github:
Deploying our service
Finally we get to the good part: deploying our service into our local Kubernetes cluster! For this, we reference typically Kubernetes behaviour of creating a Service and an Ingress. The following yaml file references the Docker image for our service that we deployed to our local Docker registry:
By saving this yaml file as service.yaml, we can deploy this to our cluster using kubectl:
And verify that requests to localhost reach our server through the Ingress controller using curl:
Putting Everything Together
This post has covered a lot of ground. Thankfully, each of these steps can be automated so we don’t have to start from scratch each time. You can use the following Bash script to create a Kubernetes cluster with Ingress any time. Use this for local development, QA, or continuous integration!
How to start your career in DevOps and Cloud ?

Are you new to DevOps & Cloud?
Then start learning the below tools with good practice.
Cloud: Start with AWS, learn & practice it well then move to other clouds like Azure & Google Cloud. Openstack is Optional
Programming/scripting: Bash/python/Groovy/Powershell
Infrastructure Orchestration: Terraform
Configuration Management: Ansible/Chef/Puppet - Ansible is good to begin with
Containers: Docker
Container Orchestration :Kubernetes
CI/CD: Jenkins
Repository: Github/Bitbucket/Git
DataStore: Sql (postgress) & nosql (Mongodb/Redis)
Last but not least learn apache/tomcat, Nginx.
Learning above tools/technologies will transition you to DevOps/Cloud profile.
If you have any Suggestions/Questions/Comments, feel free to share in the below comment section.
Introduction to kubernetes - k8s

Kubernetes is a portable, extensible, open-source platform for managing containerized workloads and services, that facilitates both declarative configuration and automation. It has a large, rapidly growing ecosystem. Kubernetes services, support, and tools are widely available.
The name Kubernetes originates from Greek, meaning helmsman or pilot. Google open-sourced the Kubernetes project in 2014. Kubernetes combines over 15 years of Google's experience running production workloads at scale with best-of-breed ideas and practices from the community.
Kubernetes Cluster
1. master nodes which run the Kubernetes related daemons (Kube API, Kube proxy, Kube DNS, Kube dashboard,)
2. Cluster nodes belonging to one or more node pools which serve as the underlying physical resources for all the containers.
Node pools
A homogenous set of physical resources that provide the underlying resources for the cluster. A cluster can have one or more instance groups with labels to provide information to the Kubernetes scheduler on what can be run on the provided hardware.Containers
A container is a resource running a single image (generally a docker image) containing all executable packages, runtime, operating system, system libraries. This is analogous to docker containers used by other orchestration tools.Pod
Pods are the smallest deployable units of computing that can be created and managed in Kubernetes. A pod is a set of one or more containers deployed and run together, sharing the same local network space. The recommendation is to run one container on a pod so that you can atomically control a process at a Kubernetes level but multi-container pods are not uncommon.ReplicaSet
A ReplicaSet ensures that a specified number of pod replicas are running at any time. In other words, a ReplicaSet makes sure that a pod or a homogeneous set of pods is always up and available.Deployment
A Deployment controller provides a declarative wrapper on top of replica sets defining the templates used to build the homogenous pods and the replication number. Even if you need to just run one container instance of a particular service, it is recommended to create a deployment for it with a configuration of 1 replica.Horizontal Pod Scaler
With Horizontal Pod Autoscaling, Kubernetes automatically scales the number of pods in a replication controller, deployment, or replica set based on observed CPU utilization (or, with custom metrics support, on some other application-provided metrics).Daemonset
A DaemonSet ensures that all (or some) Nodes run a copy of a Pod. As nodes are added to the cluster, Pods are added to them. As nodes are removed from the cluster, those Pods are garbage collected. Deleting a DaemonSet will clean up the Pods it created.Some typical uses of a DaemonSet are:
- running a cluster storage daemon, such as glusterd, ceph, on each node.
- running a logs collection daemon on every node, such as fluentd or logstash.
StatefulSets
- Used to manage stateful applications.
- Provides guarantees about the ordering and uniqueness of these Pods
- StatefulSet maintains a sticky identity for each of their Pods
- Used typically for cases where predictability of deletion and creation order is important.
Service
A Service is an abstraction that defines a logical set of Pods and a policy by which to access them — sometimes called a micro-service. So if a deployment from the previous step exposed a web service through a port, then a service is how you would expose the deployment.A service can be exposed outside using a load balancer or a cluster IP that is reachable from within the K8s cluster. The load balancer is a cloud-native LB like ELB in AWS. The cluster IP is a virtually routable IP.
Additionally, Kubernetes also gives each service a routable A record of the form $service-name.$namespace.svc.cluster.local
Configmap
Network Topology
- all pods can communicate with all other pods without NAT
- all nodes can communicate with all pods (and vice-versa) without NAT
- the IP that a pod sees itself as is the same IP that others see it as
Running Commands as Another User via sudo

Suppose you want user smith to be able to run a given command as user jones.
User smith will be prompted for his own password, not jones’s.
The ALL keyword, which matches anything, in this case specifies that the line is valid on any host.
sudo exists for this very reason!
To authorize root privileges for smith, replace “jones” with “root” in the above example.
Kubectl commands - Kubernetes
kubectl syntax, describes the command operations, and provides common examples. For details about each command, including all the supported flags and subcommands, see the kubectl reference documentation.
List all services
kubectl get services
kubectl get svc
List everything
kubectl get all --all-namespacesDescribe service <name>
kubectl describe svc <name>Get services sorted by name
kubectl get services –sort-by=.metadata.nameList all pods
kubectl get podsWatch nodes continuously
kubectl get pods -wGet version information
kubectl get versionGet cluster information
kubectl get cluster-infoGet the configuration
kubectl config viewOutput information about a node
kubectl describe node <node-name>List the replication controllers
kubectl get rcList the replication controllers in specific <namespace>
kubectl get rc -n <namespace-name>Describe replication controller <name>
kubectl describe rc <name>Delete pod <name>
kubectl delete pod <name>Delete replication controller <name>
kubectl delete rc <name>Delete service <name>
kubectl delete svc <name>Remove <node> from the cluster
kubectl delete node <name>Show metrics for nodes
kubectl top nodesShow metrics for pods
kubectl top podsWatch the Kublet logs
watch -n 2 cat /var/log/kublet.logGet logs from service <name>, optionally selecting container <$container>
kubectl logs -f <name> [-c <$container>] execute <command> on <service>, optionally selecting container <$container>
kubectl exec <service> <command> [-c <$container>]Initialize your master node
kubeadm initJoin a node to your Kubernetes cluster
kubeadm join --token <token> <master-ip>:<master-port>Create namespace <name>
kubectl create namespace <namespace>Allow Kubernetes master nodes to run pods
kubectl taint nodes --all node-role.kubernetes.io/masterReset current state
kubeadm resetList all secrets
kubectl get secretsLaunch a pod called <name> ,using image <image-name>
kubectl run <name> --image=<image-name>Create a service described in <manifest.yaml> file
kubectl create -f <manifest.yaml>Validate yaml file with dry run
kubectl create --dry-run --validate -f sysaix.yamlScale replication controller
kubectl scale rc <name> --replicas=<count>Stop all pods on specific pods
kubectl drain <n> --delete-local-data --force --ignore-deamonsetsExplain resource
kubectl explain pods
kubectl explain svc
Open a bash terminal in a pod
kubectl exec -it sysa'xpod shCheck pod environment variables
kubectl exec sysaixpod envFilter pods by label
kubectl get pods -l owner=emreList statefulset
kubectl get stsScale statefulset
kubectl scale sts <stateful_set_name> --replicas=5Delete statefulset only (not pods)
kubectl delete sts <stateful_set_name> --cascade=falseView all events
kubectl get events --all-namespacesHow to enable Accelerated Networking on an existing VM - AZURE
https://docs.microsoft.com/en-us/azure/virtual-network/create-vm-accelerated-networking-cli
https://docs.microsoft.com/en-us/azure/virtual-network/create-vm-accelerated-networking-powershell
so I’ve deallocate the VM and change the size to DS3 v2, that’s a supported VM size.

Then run the following PowerShell Commands
$nic = Get-AzureRmNetworkInterface -ResourceGroupName "bigvnetgroup" -Name "server2016344"$nic.EnableAcceleratedNetworking = $true$nic | Set-AzureRmNetworkInterface

Zabbix JMX monitoring setup for Linux server
JMX monitoring has native support in Zabbix in the form of a Zabbix daemon called “Zabbix Java gateway”, introduced since Zabbix 2.0.
To retrieve the value of a particular JMX counter on a host, Zabbix server queries the Zabbix Java gateway, which in turn uses the JMX management API to query the application of interest remotely.
What is Java and JMX monitoring?
JMX monitoring can be used to measure all JMX counters of a Java application. Java Management Extensions (JMX) is a Java Community Process (JSR-3) specification for managing and monitoring Java applications. Via a so-called Java gateway, the Zabbix server can address the JMX monitoring services, read data from a Java application and save and process it as an item.
A typical use case is the monitoring of the memory consumption of a Java application or of the Java runtime environment in which the application is operated.

Zabbix Java gateway
The so-called Zabbix Java Gateway is a special bollard process that can retrieve data via JMX. Unlike the previously mentioned boll processes, this is not an "internal" process within the Zabbix server. The Java Gateway is a stand-alone daemon that provides data to the Zabbix server through a TCP port. The Java Gateway is Java software that requires a JRE.
Enable Java Gateway
To use JMX monitoring, you must install the Zabbix Java Gateway, which is typically not included in the default installation. If you are using Zabbix LLC DEB or RPM packages , install the Java Gateway as follows. The Java Gateway requires no configuration and can be started immediately.You should now find startup and shutdown scripts in the /opt/zabbix-java-gateway/sbin/zabbix_java folder .
cd /opt/zabbix-java-gateway/sbin/zabbix_java
Test if the Java Gateway is running.
# ps -ef| grep -i java
Java Gateway as data provider for the Zabbix server
If the host on which JMX application is running is monitored by Zabbix proxy, then you specify the connection parameters in proxy configuration file instead.
JavaGateway=<Client IP Address> JavaGatewayPort=10052
By default, server does not start any processes related to JMX monitoring. If you wish to use it, however, you have to specify the number of pre-forked instances of Java pollers. You do this in the same way you specify regular pollers and trappers.
StartJavaPollers=5
Do not forget to restart server or proxy, once you are done with configuring them.
Enter the Java Gateway in the file /etc/zabbix/zabbix_server.conf . In the Zabbix server, activate at least one Java bollard, which "requests" the item data from the Java gateway and forwards the server process. After you make the changes, restart the Zabbix server.
NOTE: This is a one time setup in the zabbix server and need NOT be modified again for every new server that we add to the Zabbix WebUI.
Enabling remote JMX monitoring for Java application
A Java application does not need any additional software installed, but it needs to be started with the command-line options specified below to have support for remote JMX monitoring.
As a bare minimum, if you just wish to get started by monitoring a simple Java application on a local host with no security enforced, start it with these options:
export CATALINA_OPTS="$CATALINA_OPTS -Dcom.sun.management.jmxremote -Dcom.sun.management.jmxremote.port=10052 -Dcom.sun.management.jmxremote.ssl=false -Dcom.sun.management.jmxremote.authenticate=false -Djava.rmi.server.hostname=ClientIP -Djava.net.preferIPv4Stack=true"
Configuring JMX interfaces and items in Zabbix frontend
With Java gateway running, server knowing where to find it and a Java application started with support for remote JMX monitoring, it is time to configure the interfaces and items in Zabbix GUI.Before retrieving data from the JMX interface, you must specify for each host on which IP address and on which TCP port the JMX interface of the Java program listens. Navigate to the host configuration and add a JMX interface. If you want to monitor several Java programs via JMX on a host, you must use different TCP ports.

Apply the appropriate JMX template to the server in the zabbix webUI like JMX generic template and you can see that the JMX turns green and is enabled.
Modern way of /etc/motd - FireMotd for linux

Depending of the chosen theme FireMotD will output all information defined in the theme on your server.
We need EPEL repository to be installed and enabled in the server to install the dependency packages.
Install Dependencies
yum install bc sysstat jq moreutilsAfter installing the dependencies, clone/download or copy the FireMotd to the root directory as shown.
git clone https://github.com/OutsideIT/FireMotD.gitChange to the FireMotd directory and run the below commands
To install to /usr/local/bin/FireMotD
sudo make installWith this you can probably run FireMotD from anywhere in your system. If not, you need to add /usr/local/bin to your $PATH variable. To adjust the installation path, change the var IDIR=/usr/local/bin in the Makefile to the path you want.
To install bash autocompletion support
sudo make bash_completionWith this you can use TAB to autocomplete parameters and options with FireMotD. Does not require the sudo make install above (system install), but requires the bash-completion package to be installed and working. Then you should logout-login or source the bash completion file, eg. $ . /etc/bash_completion.d/FireMotD
If you don't have root access, just install everything on your user's folder and source the file from your user's .profile file
Crontab to get system information
The recommended way to generate /var/tmp/FireMotD.json is by creating a separate cron file for firemotd like this:
sudo vim /etc/cron.d/firemotd
But you can also put it in root's crontab (without the user field):
sudo crontab -e
Adding FireMotD to run on login
To add FireMotD to a single user
Edit the user's ~/.profile file, ~/.bash_profile file, or the ~/.bashrc file
nano ~/.profile
Add the FireMotD call at the end of the file (choose your theme)
/usr/local/bin/FireMotD -t blue
To add FireMotD to all users
You may call FireMotD from a few different locations for running globally.
Eg./etc/bash.bashrc, /etc/profile.
we use /etc/profile, so add the line to this file.
Blue

Red

Gray


