Setup monitoring with Prometheus and Grafana in Kubernetes — Start monitoring your Kubernetes cluster resources

When you run a Kubernetes cluster on eg. Amazon EKS as I did, it will be very useful to monitor your resources used, how the pods are and metrics received from other services inside Kubernetes.
This guide about Kubernetes monitoring with Prometheus and Grafana is expected to know how Kubernetes in essential works and what Metrics data are, I will not go into the deep about it for this article.
Prometheus configuration
I love to isolate using a namespace in Kubernetes and it makes everything easier to watch where the resources are used so late to create a namespace for our monitoring work area.
kubectl create ns monitoring
Now we have the namespace created we are ready to add Prometheus from Helm into our cluster and install Prometheus inside our monitoring namespace.
helm repo add prometheus-community https://prometheus-community.github.io/helm-charts |
helm repo update |
helm install prometheus prometheus-community/prometheus -n monitoring |
When you can confirm it's installed and up and running we can export the pod name and create a port forward from our local system into our cluster using the port-forward command.
export POD_NAME=$(kubectl get pods --namespace monitoring -l "app=prometheus,component=server" -o jsonpath="{.items[0].metadata.name}") |
kubectl --namespace monitoring port-forward $POD_NAME 9090 |
You will see the list of port 9090 listen on traffic, so now visit http://localhost:9090/ in your browser and see it working

It's working when you see this screen and you can now close the port forward and prepare for the Grafana setup for our visual monitoring.
Grafana configratuion
What I want here is to add Grafana to Helm and install Grafana, I will use LoadBalancer because I expect to visit my monitoring on a public URL and do not want to use proxy forward every time I should visit my system data and then I use a default password for testing to, you should change it in production for a strong password.
| helm repo add grafana https://grafana.github.io/helm-charts |
| helm install grafana grafana/grafana --namespace monitoring --set persistence.enabled=true --set persistence.storageClassName="gp2" --set adminPassword="test123456" --set service.type=LoadBalancer |
Now when it's installed you can use the default Grafana username admin and selected password when you visit the load balancer URL.
| kubectl get svc -n monitoring |
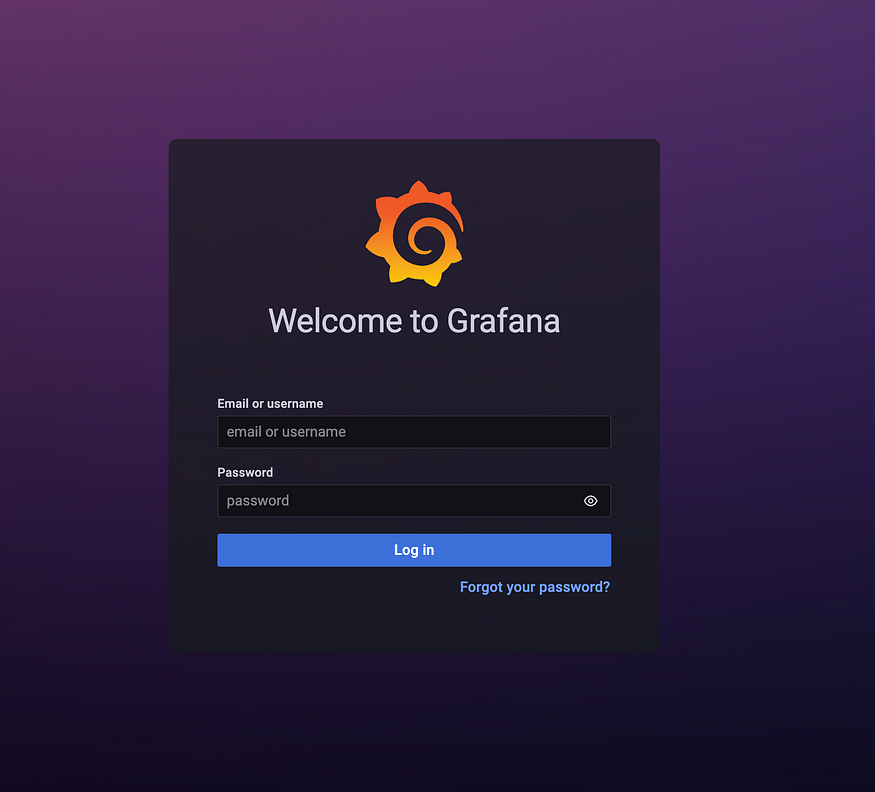
When you are going to the Grafana login screen you can log in to Grafana and prepare our data source from Prometheus.
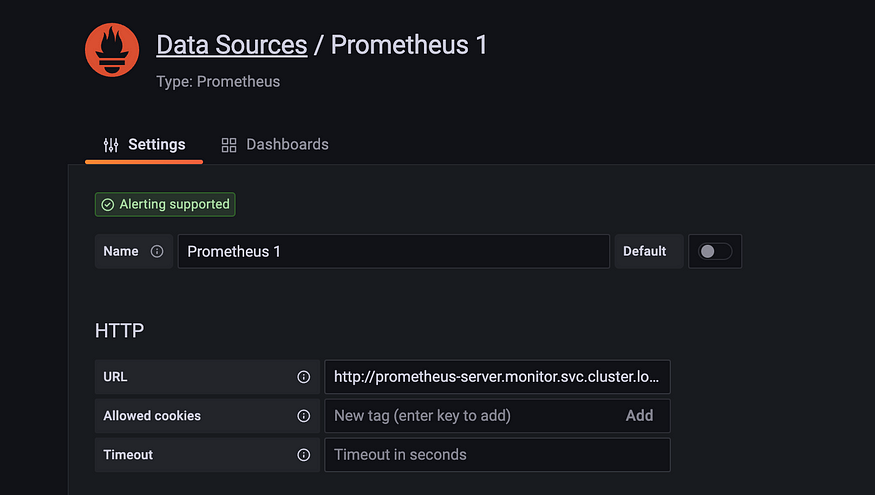
In the left menu go to Configratuion > Data Sources and click “Add data source”

Select Prometheus as your data source

You should use the URL http://prometheus-server.monitoring.svc.cluster.local and scroll down and click save & test, and you should be good to go.
Now lets prepare a new dashboard for Kubernetes metrics data, click on your left menu again then Dashboard > Import
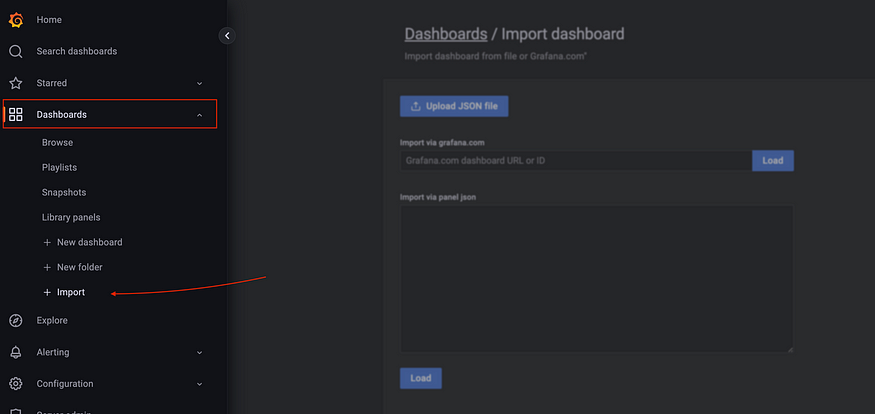
To add Kubernetes dashboard into Grafana you can go to https://github.com/dotdc/grafana-dashboards-kubernetes/blob/master/dashboards/k8s-views-global.json and copy the JSON content and paste it into the text area and click on the load button.
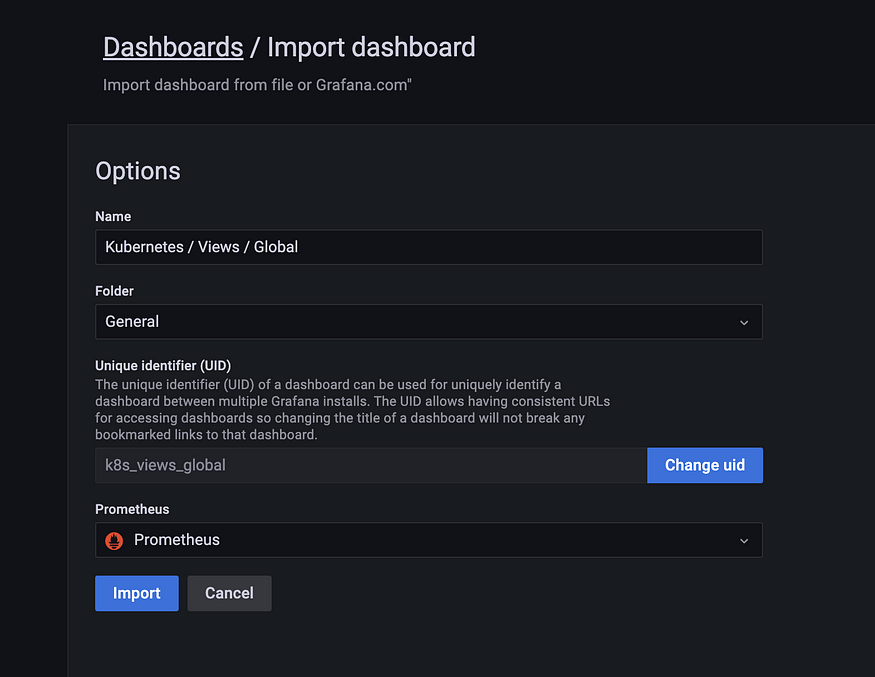
Select your Prometheus data source and click Import again.
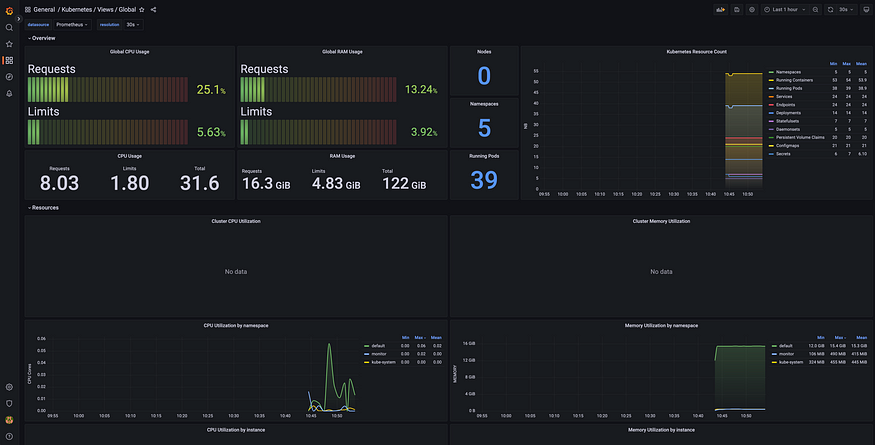
Now your dashboard will look like my dashboard in this sample here! :)


