Top Platform Engineering Tools (2024)
Platform engineering tools empower developers by enhancing their overall experience. By eliminating bottlenecks and reducing daily friction, these tools enable developers to accomplish tasks more efficiently. This efficiency translates into improved cycle times and higher productivity.
In this blog, we explore top platform engineering tools, highlighting their strengths and demonstrating how they benefit engineering teams.
What is Platform Engineering?
Platform Engineering, an emerging technology approach, enables the software engineering team with all the required resources. This is to help them perform end-to-end operations of software development lifecycle automation. The goal is to reduce overall cognitive load, enhance operational efficiency, and remove process bottlenecks by providing a reliable and scalable platform for building, deploying, and managing applications.
Importance of Platform Engineering
- Platform engineering involves creating reusable components and standardized processes. It also automates routine tasks, such as deployment, monitoring, and scaling, to speed up the development cycle.
- Platform engineers integrate security measures into the platform, to ensure that applications are built and deployed securely. They help ensure that the platform meets regulatory and compliance requirements.
- It ensures efficient use of resources to balance performance and expenditure. It also provides transparency into resource usage and associated costs to help organizations make informed decisions about scaling and investment.
- By providing tools, frameworks, and services, platform engineers empower developers to build, deploy, and manage applications more effectively.
- A well-engineered platform allows organizations to adapt quickly to market changes, new technologies, and customer needs.
Best Platform Engineering Tools
Typo
Typo is an effective software engineering intelligence platform that offers SDLC visibility, developer insights, and workflow automation to build better programs faster. It can seamlessly integrate into tech tool stacks such as GIT versioning, issue tracker, and CI/CD tools.
It also offers comprehensive insights into the deployment process through key metrics such as change failure rate, time to build, and deployment frequency. Moreover, its automated code tool helps identify issues in the code and auto-fixes them before you merge to master.
Typo has an effective sprint analysis feature that tracks and analyzes the team’s progress throughout a sprint. Besides this, It also provides 360 views of the developer experience i.e. captures qualitative insights and provides an in-depth view of the real issues.
Kubernetes
An open-source container orchestration platform. It is used to automate deployment, scale, and manage container applications.
Kubernetes is beneficial for application packages with many containers; developers can isolate and pack container clusters to be deployed on several machines simultaneously.
Through Kubernetes, engineering leaders can create Docker containers automatically and assign them based on demands and scaling needs.
Kubernetes can also handle tasks like load balancing, scaling, and service discovery for efficient resource utilization. It also simplifies infrastructure management and allows customized CI/CD pipelines to match developers’ needs.
Jenkins
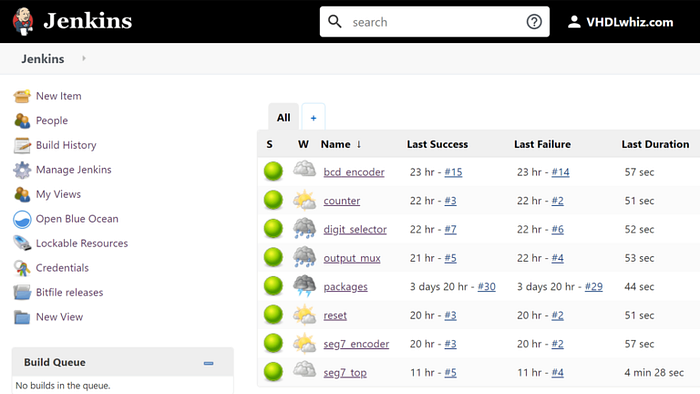
An open-source automation server and CI/CD tool. Jenkins is a self-contained Java-based program that can run out of the box.
It offers extensive plug-in systems to support building and deploying projects. It supports distributing build jobs across multiple machines which helps in handling large-scale projects efficiently. Jenkins can be seamlessly integrated with various version control systems like Git, Mercurial, and CVS and communication tools such as Slack, and JIRA.

GitHub Actions
A powerful platform engineering tool that automates software development workflows directly from GitHub.GitHub Actions can handle routine development tasks such as code compilation, testing, and packaging for standardizedizing and efficient processes.
It creates custom workflows to automate various tasks and manage blue-green deployments for smooth and controlled application deployments.
GitHub Actions allows engineering teams to easily deploy to any cloud, create tickets in Jira, or publish packages.
GitLab CI
GitLab CI automatically uses Auto DevOps to build, test, deploy, and monitor applications. It uses Docker images to define environments for running CI/CD jobs and build and publish them within pipelines. It supports parallel job execution that allows to running of multiple tasks concurrently to speed up build and test processes.
GitLab CI provides caching and artifact management capabilities to optimize build times and preserve build outputs for downstream processes. It can be integrated with various third-party applications including CircleCI, Codefresh, and YouTrack.
AWS Codepipeline
A Continuous Delivery platform provided by Amazon Web Services (AWS). AWS Codepipeline automates the release pipeline and accelerates the workflow with parallel execution.
It offers high-level visibility and control over the build, test, and deploy processes. It can be integrated with other AWS tools such as AWS Codebuild, AWS CodeDeploy, and AWS Lambda as well as third-party integrations like GitHub, Jenkins, and BitBucket.
AWS Codepipeline can also configure notifications for pipeline events to help stay informed about the deployment state.

Argo CD
A Github-based continuous deployment tool for Kubernetes application. Argo CD allows to deployment of code changes directly to Kubernetes resources.
It simplifies the management of complex application deployment and promotes a self-service approach for developers. Argo CD defines and automates the K8 cluster to suit team needs and includes multi-cluster setups for managing multiple environments.
It can seamlessly integrate with third-party tools such as Jenkins, GitHub, and Slack. Moreover, it supports multiple templates for creating Kubernetes manifests such as YAML files and Helm charts.
Azure DevOps Pipeline
A CI/CD tool offered by Microsoft Azure. It supports building, testing, and deploying applications using CI/CD pipelines within the Azure DevOps ecosystem.
Azure DevOps Pipeline lets engineering teams define complex workflows that handle tasks like compiling code, running tests, building Docker images, and deploying to various environments. It can automate the software delivery process, reducing manual intervention, and seamlessly integrates with other Azure services, such as Azure Repos, Azure Artifacts, and Azure Kubernetes Service (AKS).
Moreover, it empowers DevSecOps teams with a self-service portal for accessing tools and workflows.
Terraform
An Infrastructure as Code (IoC) tool. It is a well-known cloud-native platform in the software industry that supports multiple cloud provider and infrastructure technologies.
Terraform can quickly and efficiently manage complex infrastructure and can centralize all the infrastructures. It can seamlessly integrate with tools like Oracle Cloud, AWS, OpenStack, Google Cloud, and many more.
It can speed up the core processes the developers’ team needs to follow. Moreover, Terraform automates security based on the enforced policy as the code.
Heroku
A platform-as-a-service (PaaS) based on a managed container system. Heroku enables developers to build, run, and operate applications entirely in the cloud and automates the setup of development, staging, and production environments by configuring infrastructure, databases, and applications consistently.
It supports multiple deployment methods, including Git, GitHub integration, Docker, and Heroku CLI, and includes built-in monitoring and logging features to track application performance and diagnose issues.

Circle CI
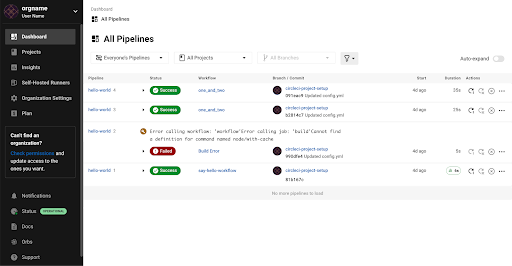
A popular Continuous Integration/Continuous Delivery (CI/CD) tool that allows software engineering teams to build, test, and deploy software using intelligent automation. It hosts CI under the cloud-managed option.
Circle CI is GitHub-friendly and includes extensive API for customized integrations. It supports parallelism i.e. splitting tests across different containers to run as clean and separate builds. It can also be configured to run complex pipelines.
Circle CI has an in-built feature ‘Caching’. It speeds up builds by storing dependencies and other frequently-used files, reducing the need to re-download or recompile them for subsequent builds.

How to Choose the Right Platform Engineering Tools?
Know your Requirements
Understand what specific problems or challenges the tools need to solve. This could include scalability, automation, security, compliance, etc. Consider inputs from stakeholders and other relevant teams to understand their requirements and pain points.
Evaluate Core Functionalities
List out the essential features and capabilities needed in platform engineering tools. Also, the tools must integrate well with existing infrastructure, development methodologies (like Agile or DevOps), and technology stack.
Security and Compliance
Check if the tools have built-in security features or support integration with security tools for vulnerability scanning, access control, encryption, etc. The tools must comply with relevant industry regulations and standards applicable to your organization.
Documentation and Support
Check the availability and quality of documentation, tutorials, and support resources. Good support can significantly reduce downtime and troubleshooting efforts.
Flexibility
Choose tools that are flexible and adaptable to future technology trends and changes in the organization’s needs. The tools must integrate smoothly with the existing toolchain, including development frameworks, version control systems, databases, and cloud services.
Proof of Concept (PoC)
Conduct a pilot or proof of concept to test how well the tools perform in the environment. This allows them to validate their suitability before committing to full deployment.
Conclusion
Platform engineering tools play a crucial role in the IT industry by enhancing the experience of software developers. They streamline workflows, remove bottlenecks, and reduce friction within developer teams, thereby enabling more efficient task completion and fostering innovation across the software development lifecycle.
💡Understanding Common IT Error Codes🚦🚨

In the world of Information Technology (IT), error codes are essential tools for diagnosing and resolving problems. They provide a numerical or alphanumerical shorthand that tells users and technicians what has gone wrong in a system. These codes range from simple user-facing errors to complex server-side issues. Understanding the types of error codes and what they signify is crucial for troubleshooting effectively. This article explains several common categories of error codes encountered in IT systems, ranging from web servers to operating systems, hardware, and software.
1. HTTP Status Codes (Web Server Errors)
HTTP status codes are responses issued by web servers when a browser or client makes a request. They help identify whether the request was successfully processed or if there were problems.
- 1xx — Informational Responses: These codes (e.g., 100 Continue, 101 Switching Protocols) indicate that the server has received the request and is continuing the process.
- 2xx — Success: A 2xx code means the request was successfully received, understood, and accepted. The most common is 200 OK, meaning the request succeeded without issues.
- 3xx — Redirection: Codes like 301 Moved Permanently or 302 Found indicate that the requested resource has moved to a new URL.
- 4xx — Client Errors: These errors (e.g., 404 Not Found, 403 Forbidden) indicate an issue on the client-side, such as an incorrect URL or unauthorized access.
- 5xx — Server Errors: These indicate that something went wrong on the server’s side. Common codes include 500 Internal Server Error (a generic server issue) and 503 Service Unavailable (the server is temporarily overloaded or under maintenance).
2. Operating System Error Codes
Operating systems like Windows, macOS, and Linux use error codes to signal issues with system functions, file handling, and software interactions. Here are a few common types:
- Blue Screen of Death (BSOD) Codes: In Windows, a system crash generates a STOP error, often referred to as the Blue Screen of Death (BSOD). Each STOP code (e.g., 0x0000007E) corresponds to a specific error, such as memory corruption, driver failure, or hardware problems.
- File Handling Errors: In Unix-based systems, error codes like EACCES (Permission Denied) or ENOENT (No Such File or Directory) indicate specific issues with file access or existence.
- macOS Errors: Apple’s macOS also has its own error codes, like -36 I/O Error, which occurs when there’s a read/write issue on a disk, or -50 for parameter errors in file operations.
3. Application and Software Error Codes
Error codes in applications vary by software, but they generally fall into the following categories:
- Application-Specific Errors: Many software applications will have their own error codes. For example, in database systems like SQL Server, an error like Error 547 indicates a foreign key constraint violation.
- Runtime Errors: These errors (e.g., Divide by Zero or Null Reference Exception) occur when an application is running and encounters an issue, such as improper data handling or logical mistakes in code.
- Compiler Errors: In programming, compiler error codes (e.g., CS1002 in C# indicating a missing semicolon) highlight issues preventing the code from being compiled successfully.
4. Hardware and Device Error Codes
When hardware or peripherals fail, specific error codes may be generated by the system BIOS, firmware, or the operating system.
- BIOS Beep Codes: On system startup, if there’s a hardware issue like memory failure or missing components, the BIOS may emit a sequence of beeps (e.g., one long beep and two short beeps) to indicate the issue. Each pattern corresponds to a different error.
- Device Manager Error Codes (Windows): Windows uses numeric codes to signal hardware problems in Device Manager. For instance, Error Code 43 means a hardware device has reported an issue, usually due to driver problems, while Error Code 10 suggests the device cannot start, possibly due to incompatibility.
- POST Codes (Power-On Self-Test): When a computer boots up, it goes through a POST process to check essential hardware. If an error occurs, a POST code (displayed on the screen or via diagnostic lights) can help identify the problem, such as faulty RAM or a failing hard drive.
5. Database Error Codes
Databases have their own sets of error codes that help in diagnosing problems related to queries, transactions, or data integrity.
- SQL Error Codes: For example, SQLSTATE 23000 indicates an integrity constraint violation (e.g., attempting to insert a duplicate value into a primary key).
- Deadlock Errors: In databases like MySQL or SQL Server, a deadlock occurs when two processes prevent each other from accessing resources, leading to errors like Error 1205 (SQL Server), which occurs when a transaction cannot proceed due to a deadlock situation.
6. Network Error Codes
Network error codes are essential for diagnosing problems in communication between devices over a network.
- DNS Errors: Errors like DNS_PROBE_FINISHED_NXDOMAIN or DNS Server Not Responding indicate that a domain name couldn’t be resolved due to issues with the DNS server.
- Socket Errors: These errors occur when a network socket encounters an issue. For instance, WSAECONNREFUSED means a connection was refused, often because the server isn’t accepting new connections.
- Timeout Errors: Errors such as Request Timed Out or ERR_CONNECTION_TIMED_OUT mean that a network request took too long to complete, often due to server overloads or network latency.
7. API and Cloud Service Error Codes
In modern software development, APIs (Application Programming Interfaces) and cloud services play a significant role. These services have error codes to indicate issues in communication or service availability.
- API Error Codes: APIs typically return HTTP status codes combined with specific error messages. For example, a 403 Forbidden response from an API means the request is understood but not allowed due to insufficient permissions.
- Cloud Service Errors: Cloud platforms like AWS, Azure, and Google Cloud have their own error codes. For example, AWS Error 503 Slow Down suggests the system is overwhelmed and requests need to be throttled.
Conclusion
Error codes are a critical component in diagnosing and troubleshooting IT systems. From web server issues and operating system crashes to hardware malfunctions and network failures, each error code provides a roadmap to resolving underlying issues. By understanding and recognizing these codes, IT professionals can quickly identify problems and take corrective actions, improving system stability and reducing downtime.
API Design - Basics & Best practices

Introduction
Application Programming Interfaces (APIs) are the backbone of modern software development. They enable diverse applications to communicate and share data seamlessly, making it possible to integrate different systems and services effectively. Whether you’re building a simple API for a personal project or a complex one for a large-scale enterprise application, following good API design principles is crucial for creating robust, scalable, and user-friendly interfaces.
In this comprehensive guide, we will walk you through the fundamentals of API design, progressing from the basics to advanced best practices. By the end of this blog, you will have a solid understanding of how to design APIs that are efficient, secure, and easy to use.
Understanding APIs
What is an API?
An API (Application Programming Interface) is a set of rules and protocols for building and interacting with software applications. It defines the methods and data formats that applications use to communicate with external systems or services. APIs enable different software components to interact with each other, allowing developers to use functionalities of other applications without needing to understand their internal workings.
Types of APIs
- REST (Representational State Transfer):
- Uses standard HTTP methods.
- Stateless architecture.
- Resources identified by URLs.
- Widely used due to simplicity and scalability.
2. SOAP (Simple Object Access Protocol):
- Protocol for exchanging structured information.
- Relies on XML.
- Supports complex operations and higher security.
- Used in enterprise-level applications.
3. GraphQL:
- Allows clients to request exactly the data they need.
- Reduces over-fetching and under-fetching of data.
- Supports more flexible queries compared to REST.
4. gRPC:
- Uses HTTP/2 for transport and protocol buffers for data serialization.
- Supports bi-directional streaming.
- High performance and suitable for microservices.
Basic Principles of API Design
1. Consistency
Consistency is key to a well-designed API. Ensure that your API is consistent in its structure, naming conventions, and error handling. For instance:
- Use similar naming conventions for endpoints.
- Apply uniform formats for responses and errors.
- Standardize parameter names and data types.
2. Statelessness
Design your API to be stateless. Each request from a client should contain all the information needed to process the request. This simplifies the server’s design and improves scalability. Statelessness means that the server does not store any client context between requests, which helps in distributing the load across multiple servers.
3. Resource-Oriented Design
Treat everything in your API as a resource. Resources can be objects, data, or services, and each should have a unique identifier (typically a URL in RESTful APIs). Design endpoints to represent resources and use HTTP methods to perform actions on them.
4. Use Standard HTTP Methods
Follow the HTTP methods convention to perform operations on resources:
GETfor retrieving resources.POSTfor creating resources.PUTfor updating resources.DELETEfor deleting resources. Using these standard methods makes your API intuitive and easier to use.
5. Versioning
Include versioning in your API design to handle updates without breaking existing clients. Common versioning strategies include:
- URL versioning (
/v1/resource). - Header versioning (
Accept: application/vnd.yourapi.v1+json). - Parameter versioning (
/resource?version=1).
Designing a Simple RESTful API
Step 1: Define the Resources
Identify the resources your API will expose. For a simple blog API, resources might include posts, comments, and users.
Step 2: Design the Endpoints
Map out the endpoints for each resource. For example:
GET /posts- Retrieve all posts.GET /posts/{id}- Retrieve a specific post.POST /posts- Create a new post.PUT /posts/{id}- Update a specific post.DELETE /posts/{id}- Delete a specific post.
Step 3: Define the Data Models
Specify the data structure for each resource. For instance, a post might have:
{
  "id": 1,
  "title": "API Design",
  "content": "Content of the post",
  "author": "John Doe",
  "created_at": "2024-06-03T12:00:00Z"
}
Step 4: Implement the Endpoints
Use a framework like Express (Node.js), Django (Python), or Spring Boot (Java) to implement the endpoints. Ensure each endpoint performs the intended operation and returns the appropriate HTTP status codes. For example, a GET /posts endpoint might look like this in Express.js:
app.get('/posts', (req, res) => {
  // Logic to retrieve all posts from the database
  res.status(200).json(posts);
});
Advanced Best Practices
1. Authentication and Authorization
Secure your API using authentication (who you are) and authorization (what you can do). Common methods include:
- OAuth: A widely used open standard for access delegation, commonly used for token-based authentication.
- JWT (JSON Web Tokens): Tokens that encode a payload with a signature to ensure data integrity.
- API Keys: Simple tokens passed via HTTP headers or query parameters to authenticate requests.
2. Rate Limiting
Implement rate limiting to prevent abuse and ensure fair usage of your API. This can be done using API gateways or middleware. Rate limiting helps protect your API from excessive use and ensures resources are available for all users.
3. Error Handling
Provide clear and consistent error messages. Use standard HTTP status codes and include meaningful error messages and codes in the response body. For example:
{
  "error": {
    "code": 404,
    "message": "Resource not found"
  }
}
Common HTTP status codes include:
200 OKfor successful requests.201 Createdfor successful resource creation.400 Bad Requestfor client-side errors.401 Unauthorizedfor authentication errors.403 Forbiddenfor authorization errors.404 Not Foundfor non-existent resources.500 Internal Server Errorfor server-side errors.
4. Pagination and Filtering
For endpoints returning large datasets, implement pagination to manage the load and improve performance. Allow clients to filter and sort data as needed. For example:
- Pagination:
GET /posts?page=2&limit=10 - Filtering:
GET /posts?author=JohnDoe - Sorting:
GET /posts?sort=created_at&order=desc
5. Documentation
Comprehensive documentation is essential for any API. Use tools like Swagger (OpenAPI) or Postman to create interactive and up-to-date documentation. Good documentation should include:
- Detailed descriptions of endpoints.
- Request and response examples.
- Error messages and codes.
- Authentication methods.
- Sample code snippets.
6. Testing
Thoroughly test your API to ensure it handles various scenarios gracefully. Use unit tests, integration tests, and automated testing tools to validate functionality and performance. Popular testing frameworks include:
- JUnit for Java.
- PyTest for Python.
- Mocha for JavaScript. Automated testing can help catch issues early and ensure your API remains reliable as it evolves.
7. Monitoring and Analytics
Implement logging, monitoring, and analytics to track the usage and performance of your API. Tools like Prometheus, Grafana, and ELK Stack can help with this. Monitoring allows you to:
- Detect and respond to issues quickly.
- Analyze usage patterns.
- Improve the overall performance and reliability of your API.
Conclusion
Good API design is fundamental to building scalable, maintainable, and user-friendly applications. By following these principles and best practices, you can create APIs that are not only functional but also delightful to use. Start with the basics, focus on consistency and simplicity, and gradually incorporate advanced features as your API evolves.
Remember, the goal of a well-designed API is to make life easier for developers, enabling them to build powerful applications with minimal friction. Keep learning, iterating, and improving your API design skills. Happy coding!


